System monitoring is an important aspect of Linux administration as it helps a Linux user or administrator identify and later investigate the performance statuses of various operating system software and hardware elements related to the system’s disk usage, CPU utilization, and main memory consumption.
Gtop is an ideal candidate for Linux system monitoring due to its rich and graphical monitoring dashboard/interface. Its graphical display accounts for the operating system’s disk usage, CPU, and main memory info. Gtop’s visual layout also projects running processes statistics like how much resource is being utilized or overused.
Gtop Vs. Other Linux Monitoring Tools
In comparison to a system monitoring tool like htop, we can confidently make the assumption that gtop shares some performance DNA with htop.
Gtop almost delivers the same functionality as htop but takes the graphical approach. Its visual layout unravels an entire operating system’s usage information.
Gtop’s primary feature is the way it segments its visual outputs into sections. This approach makes it easier for users to identify the portion of the output related to the OS performance they wish to address or understand.
Install Gtop Monitoring Tool in Linux
To successfully install Gtop on your Linux operating system distribution, you first need to have the Node Package Manager (npm) installed and running on your system.
The installation of Node Package Manager (npm) should be preceded by the installation of the latest Node Version Manager (nvm).
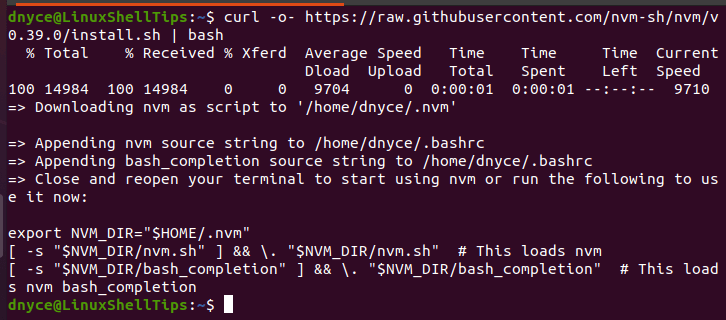
To install or update nvm, you should run the latest install script using the following cURL or Wget command:
$ curl -o- https://raw.githubusercontent.com/nvm-sh/nvm/v0.39.0/install.sh | bash
OR
$ wget -qO- https://raw.githubusercontent.com/nvm-sh/nvm/v0.39.0/install.sh | bash
Once nvm is installed, you can verify the version and install the node as shown.
$ nvm --version
$ nvm install node

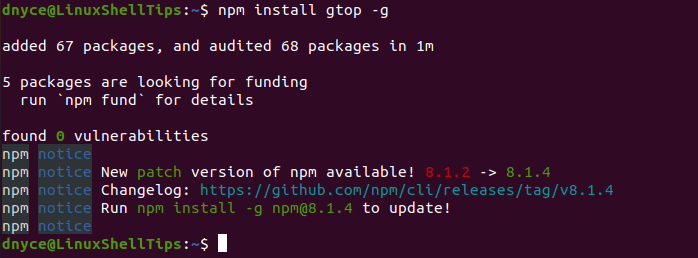
Once nvm and node packages are installed, you can install gtop as shown.
$ npm install gtop -g

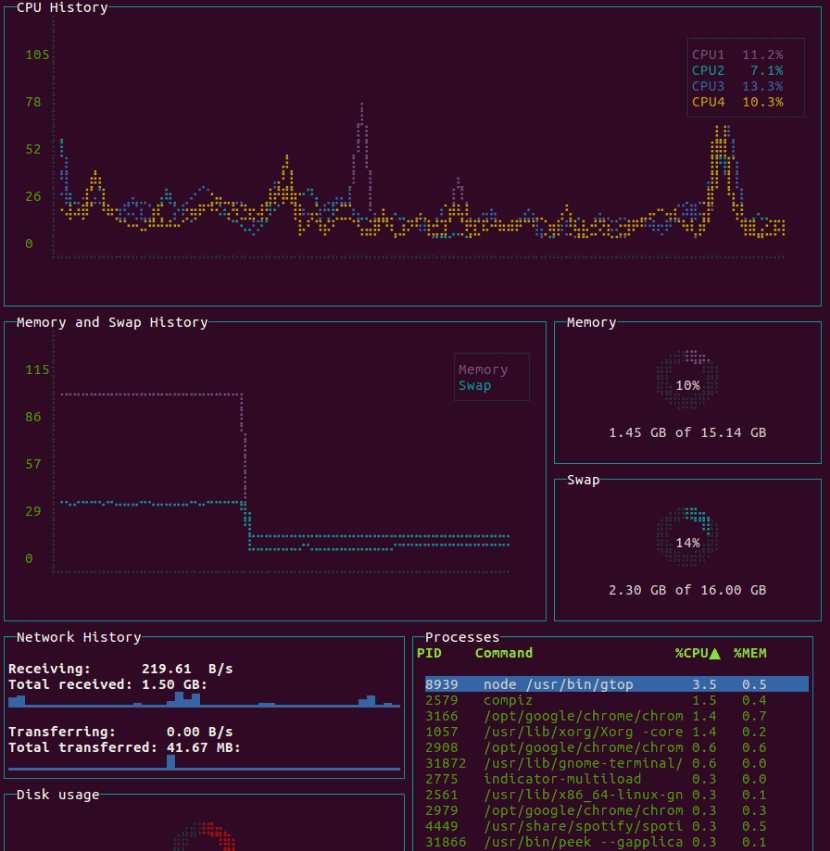
You should be presented with a straightforward graphical user interface of gtop as depicted by the screen capture below:

Gtop breaks down its system monitoring functionalities into the following sections.
- CPU History: In this section, you can see a live percentage usage summary of your computer’s CPU over the last 60 seconds.
- Memory and Swap History: Relays information relating to your Swap and Main Memory (RAM) over the last 60 seconds.
- Memory: Provides the Main Memory (RAM) percentage usage over the last minute.
- Swap: Provides the Swap Memory percentage usage over the last minute.
- Network History: Your system’s network traffic information will be displayed in this section for the last minute and in bytes-per-second.
- Disk Usage: Provides the percentage disk usage summary for the last minute. It is the physical memory where you store your processed data.
- Processes: Lists all the active processes on your system and the percentage CPU resource they are individually using.
We can confidently conclude that gtop has superiority over other system monitoring tools in terms of its summarized at-a-glance graphical display of an entire Linux system’s activity. It makes it easy to assess a system’s current performance due to its user-friendly interface.
